Charts in Open Pattern Format patterns are a powerful resource for knitters. They are packed full of features that will transform the way you interact with knitting patterns. However, the main project interface of Pattern Manager where you follow instructions and track progress is predominantly text based so you may not have realised the brilliance of charts in OPAF.
Before you get started
When starting a new project, the colours used in the pattern are displayed at the bottom of the configuration page. By default they will display the colour(s) chosen by the designer but these can be changed to best match the colours you have chosen for your project.
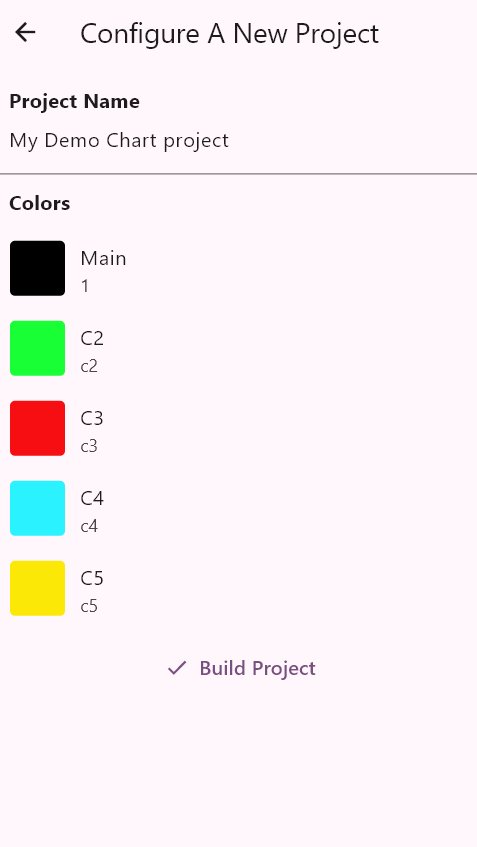

These colours are used throughout the pattern, colouring both the written instructions and the chart so that the pattern represents what you are actually knitting. Not only does this make for easy to read, colour coded written instructions, but it also allows knitters to visualise potential colour choices for colourwork projects.
If you change your mind on colours after starting the project the colours can be changed at any time from the configuration drop down menu at the top of the project.


How to find charts
All actions in a given instruction are clickable. Generally clicking on an action will show a long-hand description like you would get in an abbreviation list. These clickable actions may even have links attached if the designer wishes to show you additional content, like a technique tutorial for example.
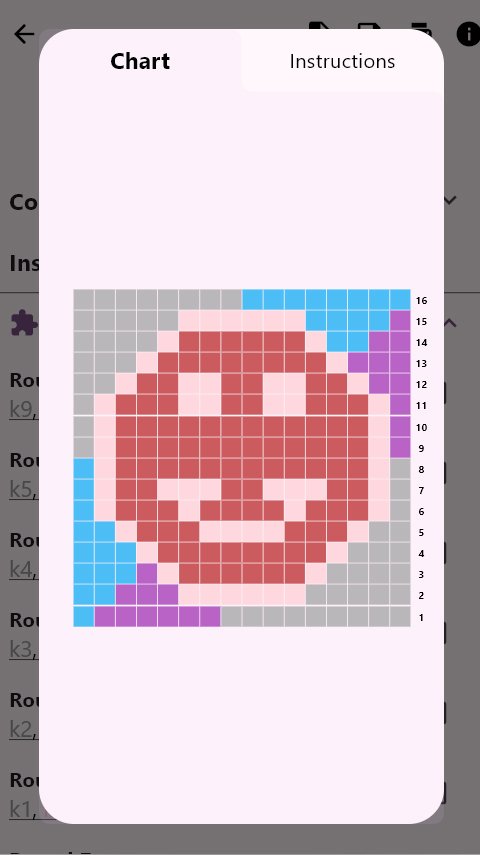
Underlined instructions have a chart associated with them so act a little differently. When clicked a window will appear displaying the chart. If multiple charts are associated with a single instruction, there will be a break in the underline where the actions for one chart end and the actions for the new chart start.
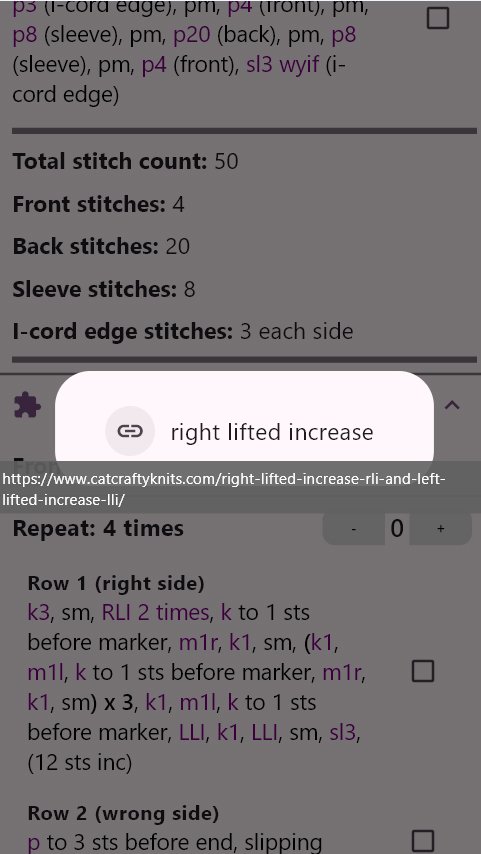
An example of the dialog that is displayed when a standard action is clicked. This action has a tutorial link associated with it which can be accessed by clicking on the link icon.

In this image, rounds 12-16 at the top show a single chart referenced in the instruction whereas rounds 1-5 at the bottom of the page show 2 different charts together in the same instruction. They are separated by a break in the underline.
Chart Features
Clicking on any given stitch in the chart will bring up a long-hand description.
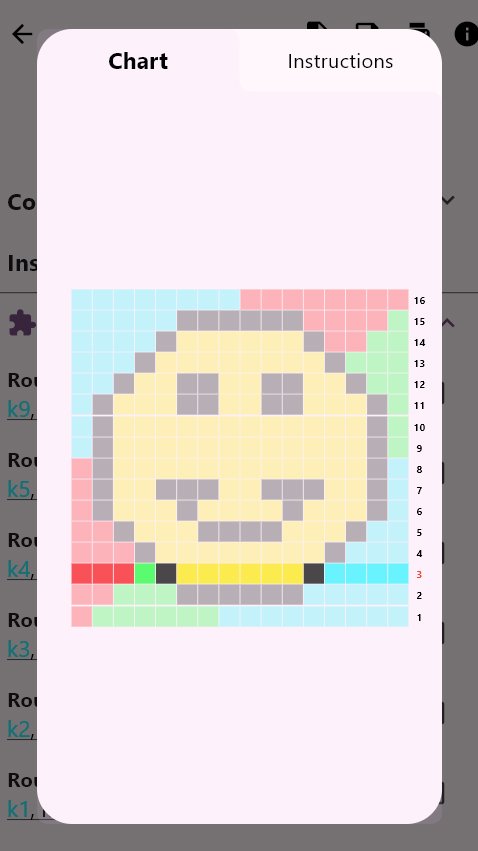
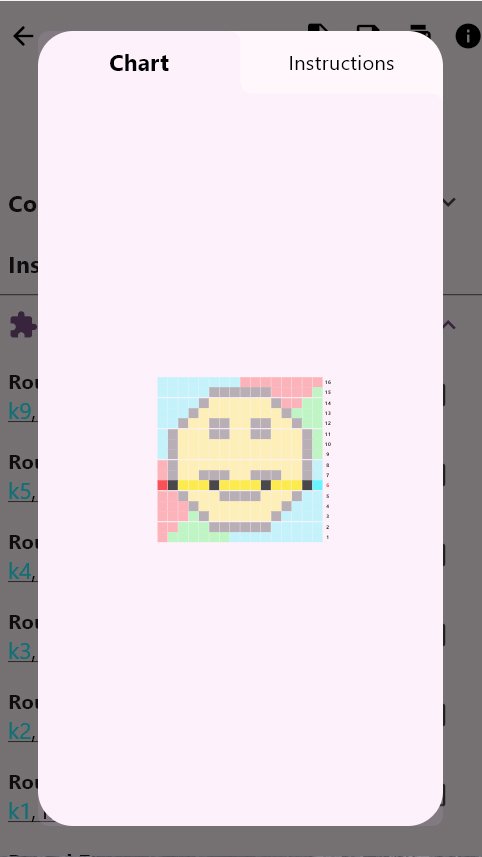
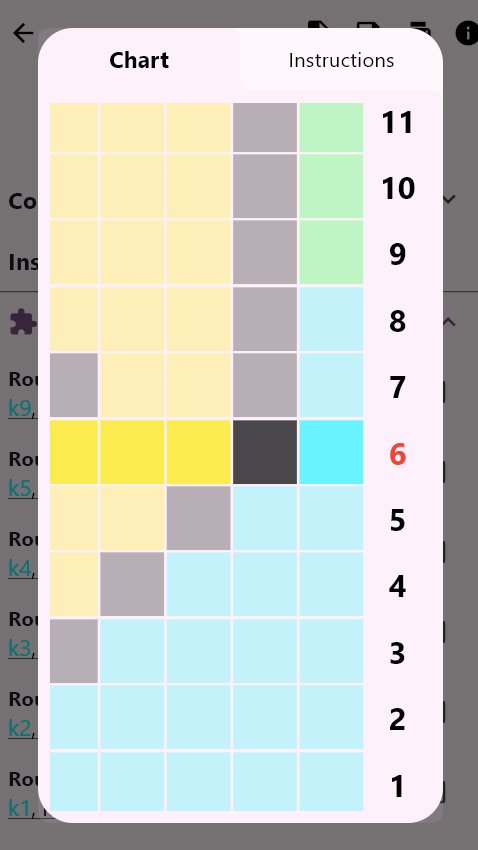
When a chart is opened from the main pattern instructions, the referenced row or round will be highlighted. The rest of the chart is still visible for context but the highlighted row shows where you are in the pattern.
To change the row highlighted, double tap on any other row. If you double tap on the already highlighted row the chart will display as normal.
Chart written instructions are also accessible from the chart dialog window. Simply click on the ‘Instructions’ tab at the top. The instructions here only show a text representation of the chart. It may not show the whole row instruction as written in the main pattern. Rows here can also be highlighted by double tapping on the row heading which turns it red.

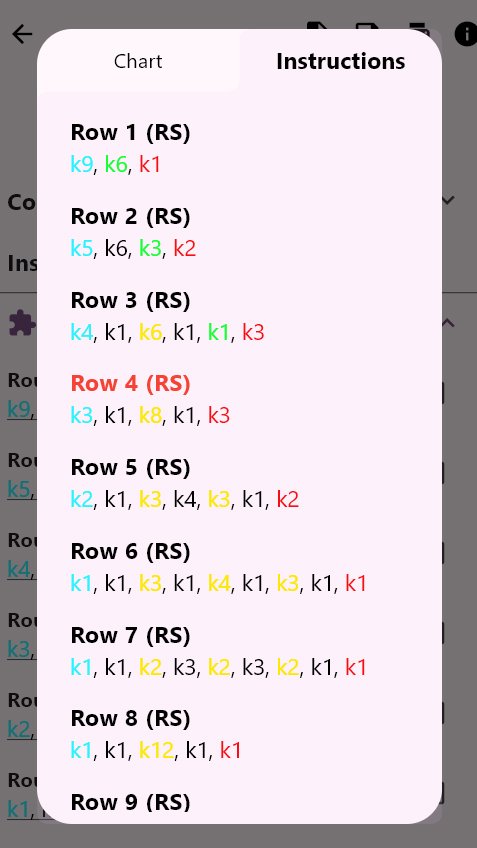
If there are no other instructions given in a row or round in the main pattern, it is fully possible to use just the written instructions that are generated alongside the chart; however to track and save progress, the rows will still need to be ticked off using the check boxes on the main pattern page. There is no way of recording progress from the chart dialog.
Finally, charts in Pattern Manager can be zoomed in or out as required. There are two supported methods to zoom a chart:
1. Pinch-to-zoom gestures if supported by your device (touch screen or trackpad)
2. Long press + vertical drag which is supported on all devices including desktops with a mouse. With a mouse simply left-click and hold whilst moving the mouse up and down. On a touchscreen long-press the chart and move your finger up and down.
Found this article helpful and want to see more? Do get in touch and let us know what topics you would like us to cover!

